COVID-19 Data sets
Miguel Icaza
Durham University
Simulation effort team:
F. Krauss, I. Vernon, R. Bower, A. Quera, C. Cuesta, C. Becker, J. Bullock, H. Troung, E. Elliot, J. Armijo....And many more new members will join next week!!


Data sets for COVID-19 analysis
Goal: present a compilation and a brief description of 5 useful public data sets
related to COVID-19
1) NPGO Corona DataSet (German):
https://npgeo-corona-npgeo-de.hub.arcgis.com/datasets
Pros:
- Individual info on all German confirmed cases.
- By far the largest scale individual data set.
Cons:
- No length of sickness info (hard to correct the biases on number of cases).
- No hospitalisation/symptoms info.
Individual data on all German patients registered
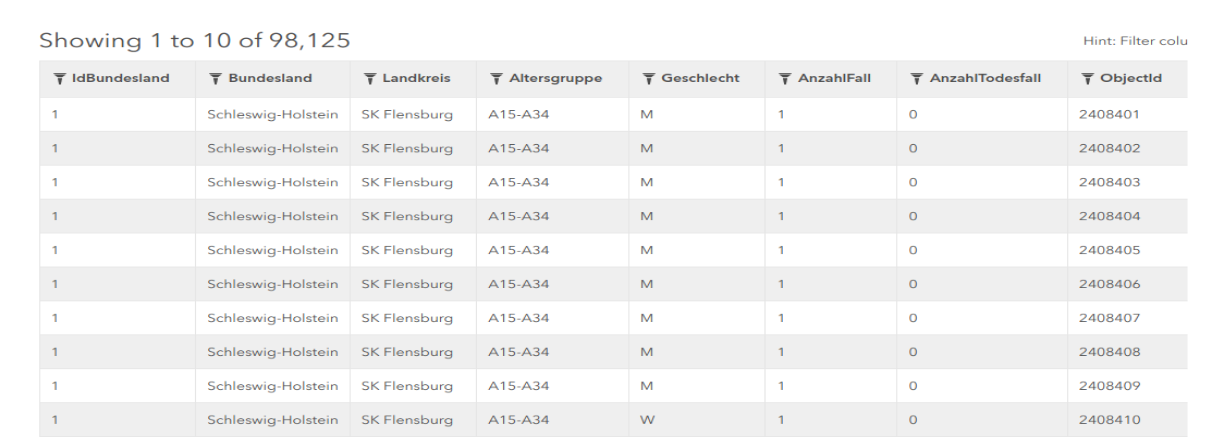
Updated Daily
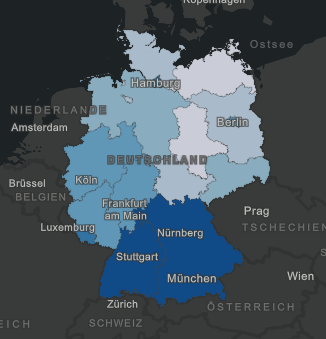
Can be combined with survey data
to do analysis state by state
--> reduces biases due to averaging cities
at different stages
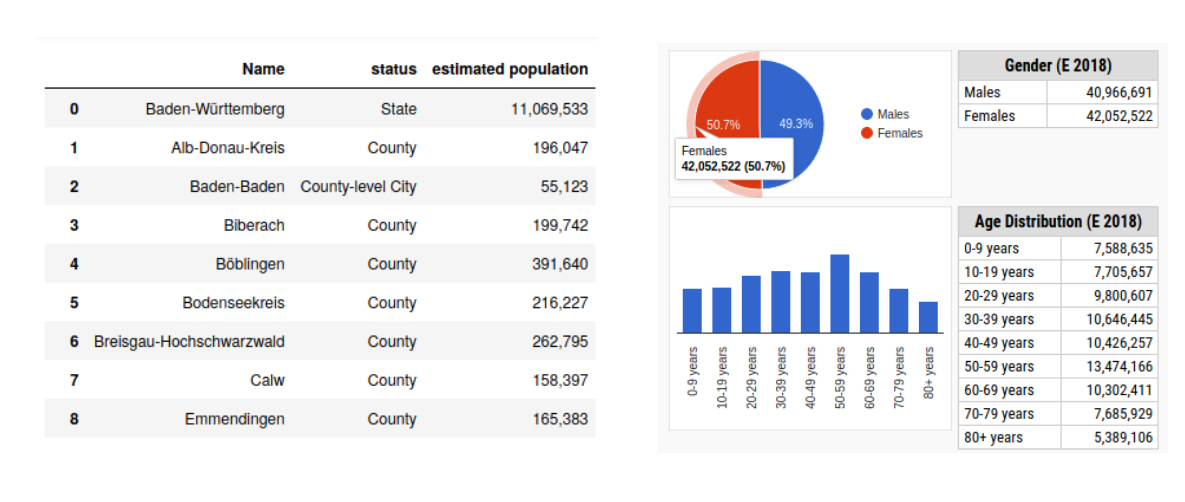
German Population estimates: https://www.citypopulation.de/en/germany/admin/
2) Vo municipality data set
https://www.medrxiv.org/content/10.1101/2020.04.17.20053157v1.supplementary-material
Cons:
- A comparatively small number of cases (2900 population, 80 infected,14 hospitalized, 3 deads).
Pros:
- Data on 80% of a town tested twice (before quarantine and after one week of quarantine).
- Ideal for computing % of asymptomatic cases (43% Lavezzo et al).
- Individual Information on symptoms.
Individual data
on 80% of the town
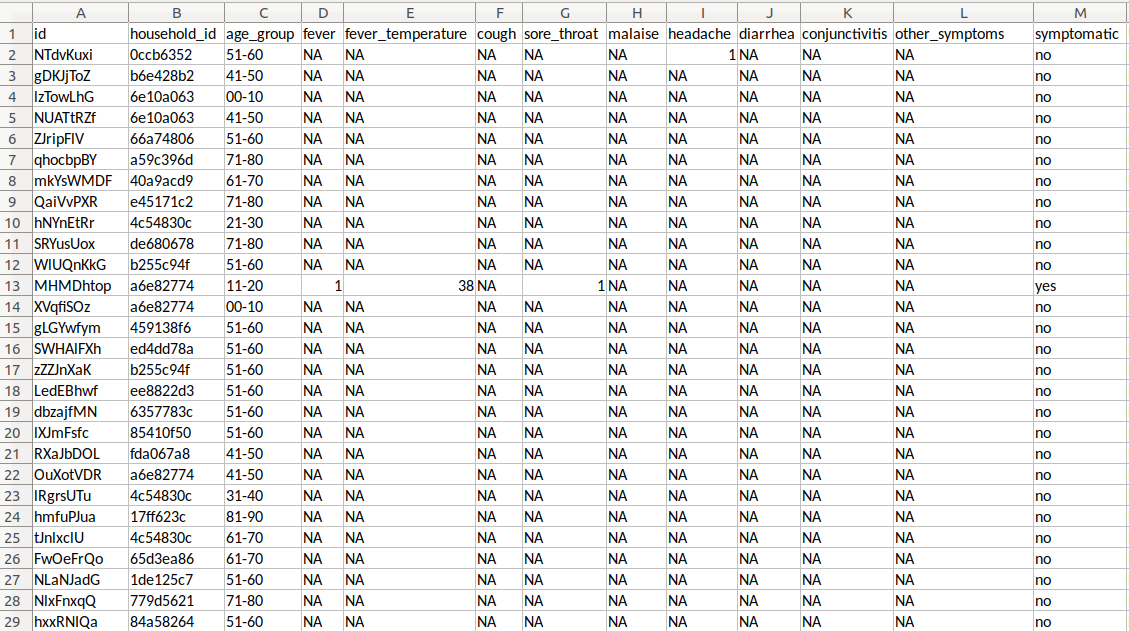
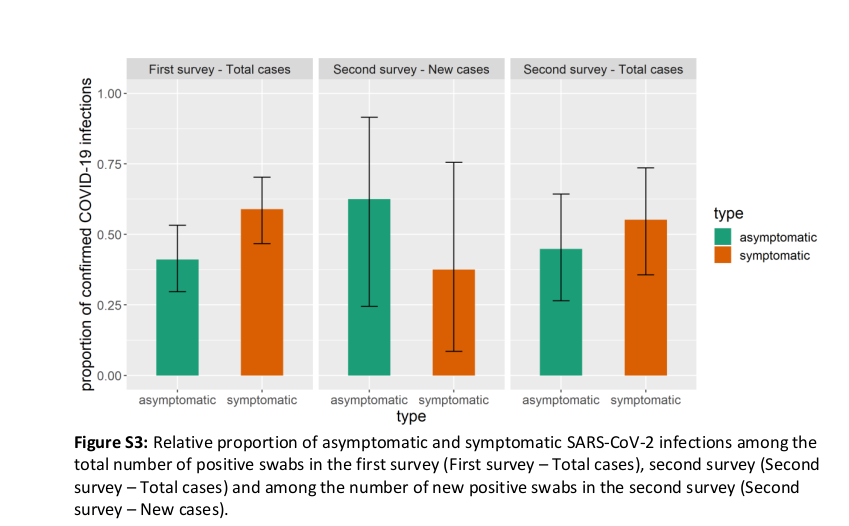
Symptomatic vs asymptomatic cases (Lavezzo et al.)
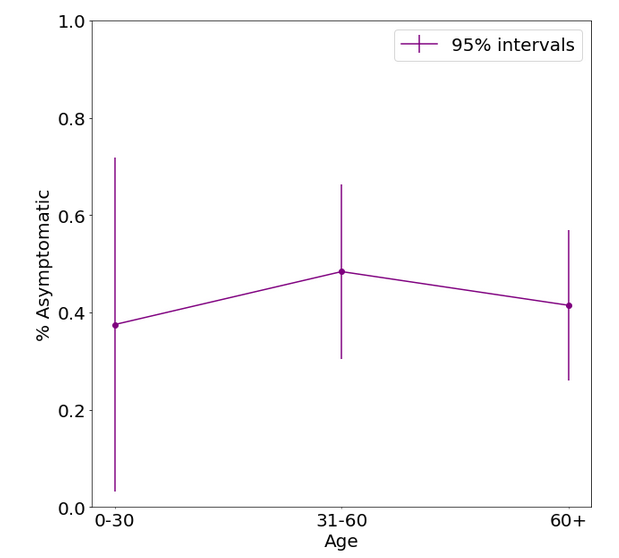
No evidence for Age-dependent Asymptomatic distribution
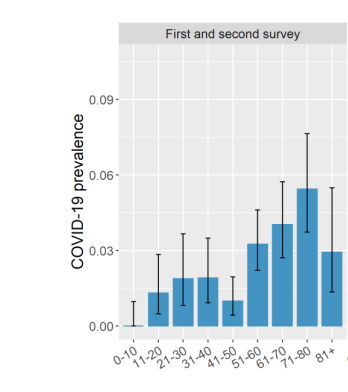
Analysis of the prevalence of COVID-19 in the population by age (Lavezzo et al.)
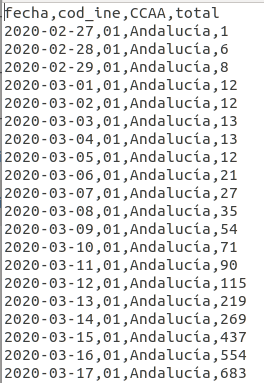
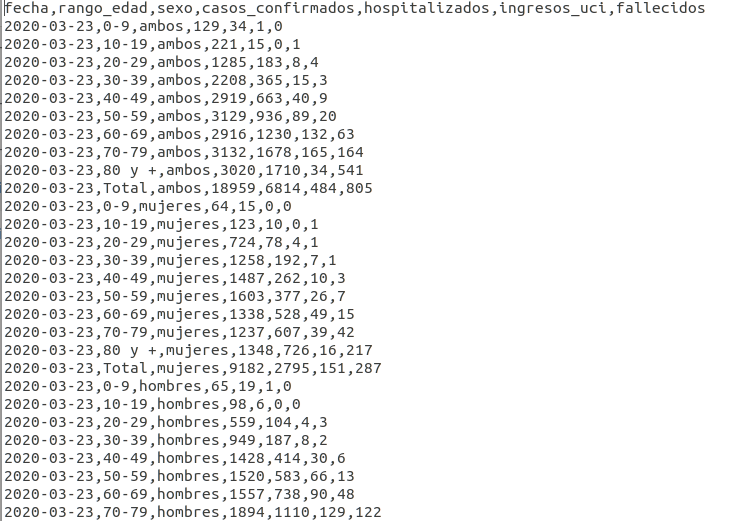
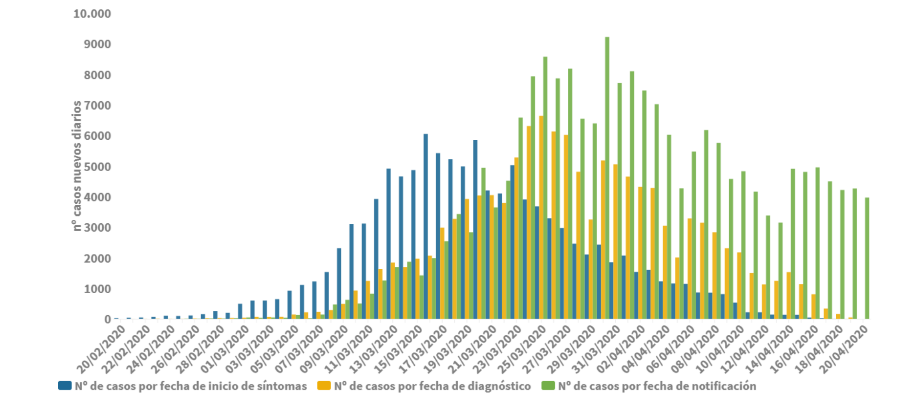
3) Spain Data Compilation
https://github.com/datadista/datasets/tree/master/COVID%2019
Note: The data is public, but you are required to make a citation
Cons:
- No individual data.
-Inconsistent dates.
Pros:
- Day by day counts on hospitalization deaths and cases.
Day by day data
Spanish Population estimates: https://www.ine.es/jaxi/Tabla.htm?path=/t20/e245/p08/l0/&file=01002.px&L=0
Good data set
for measuring evolution parameters
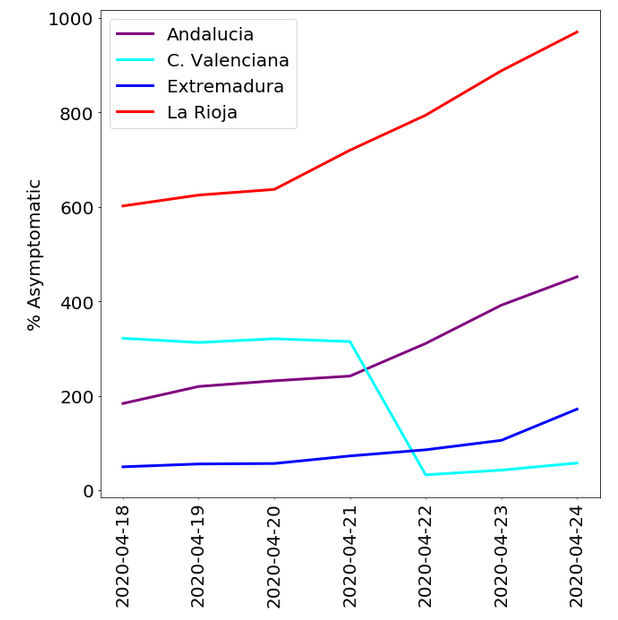
A nice bonus! asymptomatic cases, for some counties on the last days.
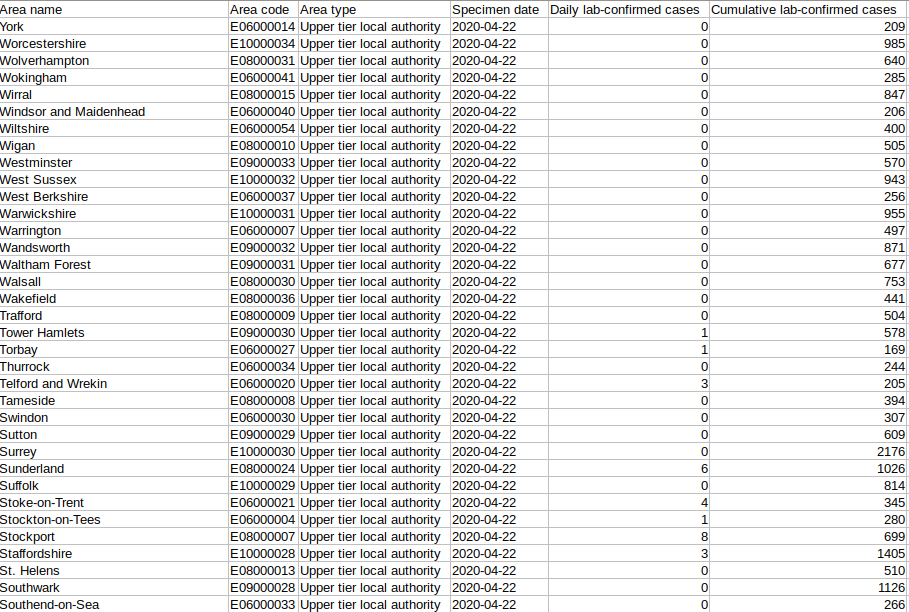
4) What about the UK?
Confirmed cases/deaths by region and day
https://coronavirus.data.gov.uk/?_ga=2.43319013.1776340741.1587649377-2109200743.1587649377
A more complete number of deaths per day:
https://www.england.nhs.uk/statistics/statistical-work-areas/covid-19-daily-deaths/
> Information is protected.
> However public data on the number of deaths and of cases per county and per day is available.
Day by day information on cases and deaths per district
Can be used for computing the number of deaths per month compared with a normal year, which is an upper limit of the death rate.
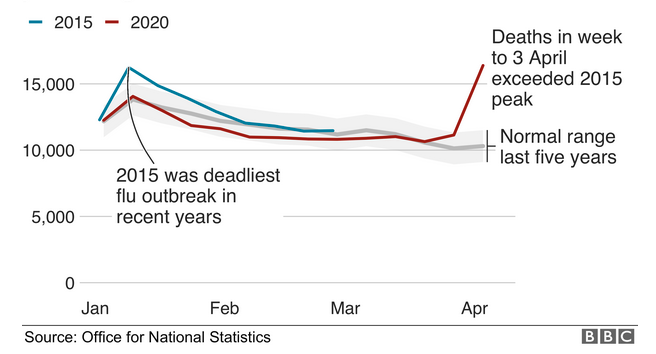
Deaths are 1.7 times the expected amount from mid March to 3 April
Historic number of deaths per month in Europe: https://ec.europa.eu/eurostat/de/data/database?node_code=demo_mor
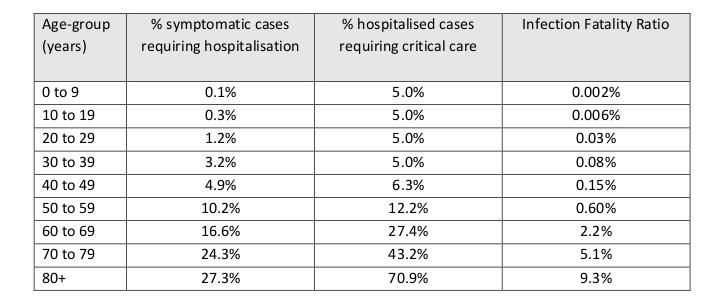
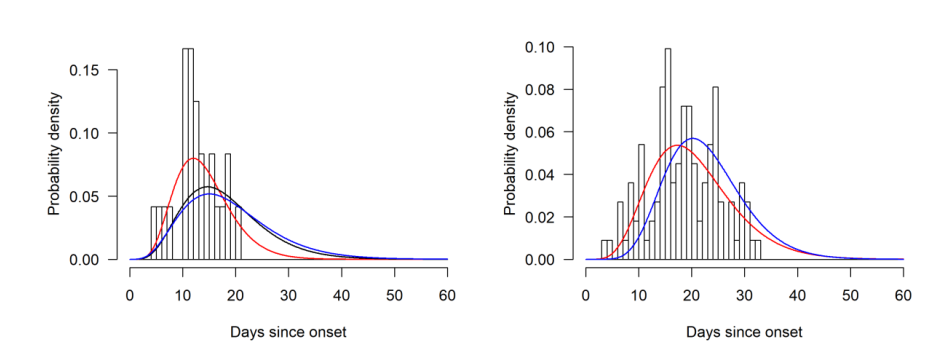
5) Verity et al. Dataset.
https://github.com/mrc-ide/COVID19_CFR_submission
> Mostly January-February data from China.
> Data used in the Imperial model.
Cons:
- The number of tests comparatively low so the number of cases estimate is higher than in other datasets.
Pros:
- Complete data set, presumably all necessary infromation for analysis
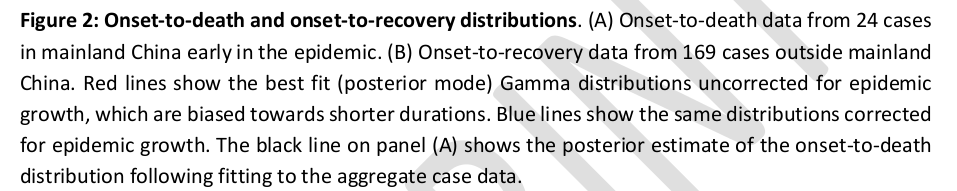
Used for Imperial model to compute:
Info between onset on symptoms and end of disease:
can be used to correct biases due to unfinished cases in the sample.
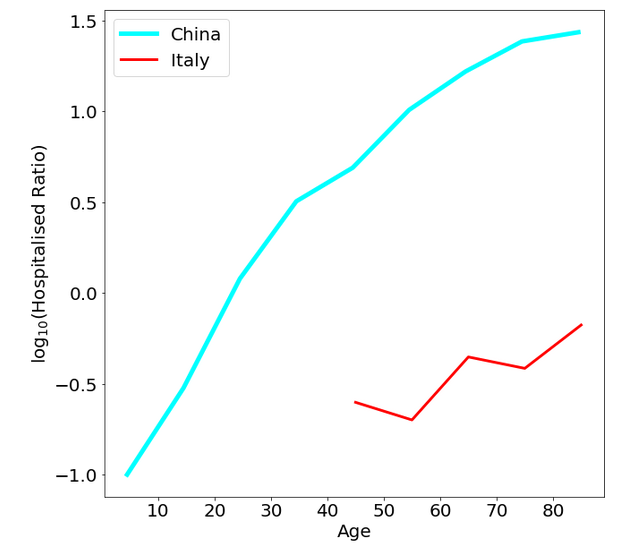
Comparing Percentage of symptomatic requiring hospitalization
Differences due to % tested??